Building Your Own Data Lake with Cloudflare: The Hidden Alternative to Enterprise SaaS
Learn how to build a cost-effective data lake using Cloudflare's tools (Pipelines, R2 Data Catalog) and DuckDB. This practical guide shows how to create a modern data platform without expensive enterprise solutions.
DuckDB is so hot right now. Cloudflare Pipelines is heating up too. And when you combine them with R2 Data Catalog, you’ve got something that just might disrupt the established data platform market.
Table of contents:
- The modern data stack dilemma
- Introducing Cloudflare’s data tools
- Building the pipeline: Ingestion to analysis
- Conclusion
The modern data stack dilemma
The Modern Data Stack has become increasingly complex and expensive. Organizations find themselves locked into proprietary platforms, paying significant egress fees, and managing complex infrastructure.
Jordan Tigani’s Big data is dead thesis rings true for many companies - most organizations don’t actually have “big data” by today’s standards, yet they’re paying for infrastructure designed to handle petabytes.
Introducing Cloudflare’s data tools
Cloudflare has quietly assembled a set of building blocks that, when combined, form a compelling data platform:
Cloudflare Pipelines
A serverless data ingestion service that can:
- Ingest up to 100 MB/s of data per pipeline
- Accept data via HTTP or Workers
- Deliver data as NDJSON files to R2
- Provide reliable, at-least-once delivery guarantees
R2 Data Catalog
A managed Apache Iceberg catalog integrated directly with R2 that:
- Exposes a standard Iceberg REST catalog interface
- Connects to engines you already use (Spark, Snowflake, PyIceberg)
- Offers ACID transactions, optimized metadata, and schema evolution
- Enables analytics workloads without egress fees
DuckDB (as your query engine)
An analytical database that:
- Can query data directly from object storage
- Provides PostgreSQL-compatible SQL
- Runs everywhere (local, serverless, etc.)
- Has deep Pandas integration
Flow Explanation:
-
Data Sources → Ingestion
- LinkedIn posts, job listings, and website content are sent to Cloudflare Pipeline
- Data format: JSON records
-
Ingestion → Raw Storage
- Pipeline writes data to R2 bucket in partitioned structure
- Location:
raw-company-data/event_date=2025-05-17/hr=05/01JVEB0M9G94N0JYVRPTH4DBRQ.json.gz - Format: Compressed JSON
-
Raw Storage → Transformation
- Python script reads raw data from R2
- Converts and cleans the data with pandas/PyArrow
- Prepares data in the correct schema for Iceberg
-
Transformation → Structured Storage
- Processed data is appended to Iceberg tables
- Location: Inside
__r2_data_catalog/with optimized file organization - Format: Parquet files (columnar storage)
-
Structured Storage → Metadata Catalog
- R2 Data Catalog maintains metadata about tables
- Tracks schema, partitioning, and file locations
- Enables efficient querying
-
Structured Storage + Metadata → Query Engine
- DuckDB reads from Iceberg tables via catalog OR
- DuckDB reads directly from raw JSON in R2
- Executes SQL queries on the data
-
Query Engine → Analytics
- Query results used for insights and visualizations
- Business intelligence dashboards
- Data science analysis
Building the pipeline: Ingestion to analysis
Let’s build a complete data platform step-by-step using Cloudflare’s services and DuckDB. This practical walkthrough will show you how these components work together to create a seamless data pipeline from ingestion to analysis.
1. Setting Up Your Pipeline
To begin building your data lake with Cloudflare, you’ll need to first create storage for your raw data and establish a pipeline for data ingestion. The commands below illustrate how simple it is to get started:
wrangler r2 bucket create raw-company-data
wrangler pipelines create company-website-data-pipeline --r2-bucket raw-company-data

🌀 Authorizing R2 bucket "raw-company-data"
🌀 Creating pipeline named "company-website-data-pipeline"
✅ Successfully created pipeline company-website-data-pipeline

Id:    0e13c5ff09b34d018152af98d06f5a1xvc
Name:  company-website-data-pipeline
Sources:
  HTTP:
    Endpoint:        https://0e13c5ff09b34d018152af98d06f5a1xvc.pipelines.cloudflare.com/
    Authentication:  off
    Format:          JSON
  Worker:
    Format:  JSON
Destination:
  Type:         R2
  Bucket:       raw-company-data
  Format:       newline-delimited JSON
  Compression:  GZIP
Batch hints:
  Max bytes:     100 MB
  Max duration:  300 seconds
  Max records:   100,000

🎉 You can now send data to your pipeline!

Send data to your pipeline's HTTP endpoint:
curl "https://0e13c5ff09b34d018152af98d06f5a1xvc.pipelines.cloudflare.com/" -d '[{ ...JSON_DATA... }]'
These two commands create the foundation of your data platform. The first creates an R2 bucket that will store your raw data, while the second establishes a pipeline that will automatically ingest data from your specified sources and deposit it into your R2 bucket. This serverless approach means you only pay for what you use, with no infrastructure to maintain.
Sending Data via HTTP Endpoints
Once your pipeline is set up, you can start ingesting data using the HTTP endpoint Cloudflare provides. The HTTP endpoint offers several configuration options:
# Simple data ingestion with curl
curl "https://0e13c5ff09b34d018152af98d06f5a1xvc.pipelines.cloudflare.com/" \
  -d '[{"user_id": 12345, "page_view": "/pricing", "timestamp": "2023-08-15T14:22:31Z"}]'
For production environments, you’ll likely want to enable authentication and configure CORS settings. This can be done through the dashboard or using Wrangler:
# Enable authentication
wrangler pipelines update company-website-data-pipeline --http-source-auth=token

# Configure CORS to allow specific origins
wrangler pipelines update company-website-data-pipeline --http-source-cors-origins="https://your-app.com,https://admin.your-app.com"
Learn more about HTTP source configuration options in the Cloudflare documentation.
Data organization with R2 Data Catalog
Once your data is in R2, you can register it with R2 Data Catalog:
wrangler r2 bucket catalog enable company-info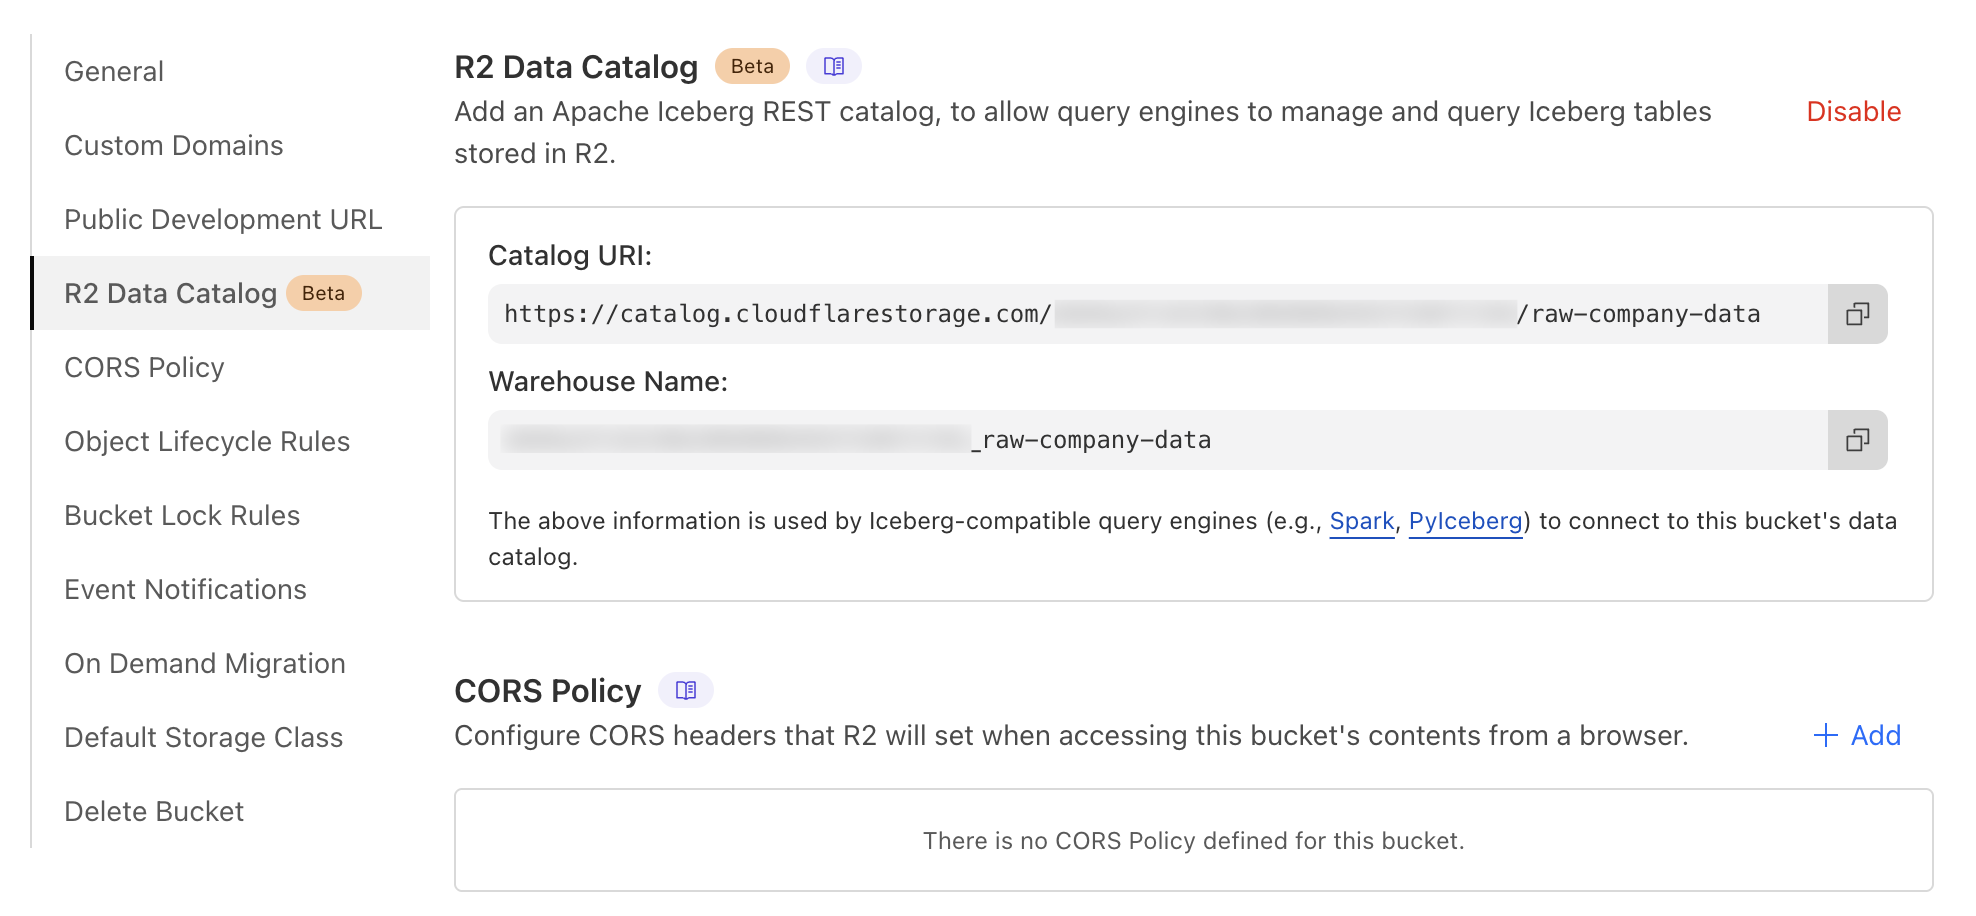
from pyiceberg.catalog.rest import RestCatalog
import pyarrow as pa

# Your R2 Data Catalog credentials
# Could be found in
# dashboard -> R2 -> Bucket -> Settings -> R2 Data Catalog
CATALOG_URI = "https://catalog.cloudflarestorage.com/{id}/raw-company-data"
WAREHOUSE = "{id}_raw-company-data"  #
# Create a token with R2 permissions in Cloudflare dashboard
# 1. Navigate to R2 Object Storage in the sidebar
# 2. Expand API dropdown and select "Manage API tokens"
# 3. Click "Create API token"
# 4. Edit the token name
# 5. Set permissions to "Admin Read & Write"
# 6. Create token and save the value
TOKEN = "your_r2_api_token_here"
# Connect to R2 Data Catalog
catalog = RestCatalog(
    name="company_intel",
    uri=CATALOG_URI,
    warehouse=WAREHOUSE,
    token=TOKEN
)

# Create a namespace if it doesn't exist
try:
    catalog.create_namespace("linkedin_data")
    print("Created namespace: linkedin_data")
except:
    print("Namespace already exists or couldn't be created")

# Create a sample table schema
schema = pa.schema([
    pa.field('post_id', pa.string()),
    pa.field('content', pa.string()),
    pa.field('hashtags', pa.list_(pa.string())),
    pa.field('url', pa.string()),
    pa.field('timestamp', pa.timestamp('us'))
])

# Create a table
try:
    table = catalog.create_table(
        identifier=("linkedin_data", "posts"),
        schema=schema,
        properties={"format-version": "2"}
    )
    print(f"Created table: linkedin_data.posts at {table.location()}")
except Exception as e:
    print(f"Error creating table: {e}")


### Query with DuckDB

```python
def query_with_duckdb_and_iceberg():
    # Step 1: Connect to the Iceberg catalog
    # Here we're establishing a connection to R2 Data Catalog using PyIceberg's RestCatalog
    # This gives us access to the metadata and table definitions stored in the catalog
    print("Connecting to Iceberg catalog...")
    catalog = RestCatalog(
        name="company_intel",
        uri=CATALOG_URI,        # The REST endpoint for our R2 Data Catalog
        warehouse=WAREHOUSE,    # Identifies our specific R2 bucket
        token=TOKEN             # Authentication token for R2 access
    )

    # Step 2: Explore available tables in our namespace
    namespace = "linkedin_data"
    tables = catalog.list_tables(namespace)
    print(f"Tables in {namespace}: {', '.join([t[1] for t in tables])}")

    # Step 3: Set up DuckDB as our query engine
    # DuckDB is an in-process analytical database, perfect for querying our data
    con = duckdb.connect(database=':memory:')  # Using in-memory mode for simplicity

    # Step 4: Enable Iceberg support in DuckDB
    # The Iceberg extension allows DuckDB to work with Iceberg table formats
    con.execute("INSTALL iceberg")
    con.execute("LOAD iceberg")

    # Step 5: Bridge Iceberg and DuckDB
    # We're loading data from Iceberg into memory via PyArrow
    table_name = tables[0][1]  # Get the first table name
    table = catalog.load_table((namespace, table_name))

    # Convert Iceberg table to pandas DataFrame via Arrow
    # This creates an in-memory representation of our data
    df = table.scan().to_arrow().to_pandas()
    print("Available columns:", ", ".join(df.columns.tolist()))

    # Step 6: Register the DataFrame with DuckDB
    # This is the key step that makes our data available for SQL queries in DuckDB
    # DuckDB will now operate directly on the pandas DataFrame in memory
    con.register(table_name, df)
    print(f"Loaded {len(df)} rows from {table_name}")

    # Step 7: Run analytical queries using DuckDB's SQL interface
    # Example 1: Get the most recent posts
    print("\nMost recent posts:")
    recent_posts = con.execute(f"""
    SELECT
        post_id,
        content as content_preview,
        timestamp
    FROM {table_name}
    ORDER BY timestamp DESC
    LIMIT 20
    """).fetchdf()
    print(recent_posts)

    # Example 2: Analyze posting frequency by day
    print("\nTime analysis of posts:")
    time_analysis = con.execute(f"""
        SELECT
            date_trunc('day', timestamp) as post_date,
            COUNT(*) as post_count
        FROM {table_name}
        GROUP BY post_date
        ORDER BY post_date ASC
        LIMIT 10
    """).fetchdf()
    print(time_analysis)

    # Example 3: Analyze hashtag usage
    # This demonstrates DuckDB's ability to unnest arrays - perfect for JSON-like data
    print("\nHashtag analysis:")
    hashtag_analysis = con.execute(f"""
        WITH exploded AS (
            SELECT
                unnest(hashtags) as hashtag
            FROM {table_name}
            WHERE array_length(hashtags) > 0
        )
        SELECT
            hashtag,
            COUNT(*) as frequency
        FROM exploded
        GROUP BY hashtag
        ORDER BY frequency DESC
        LIMIT 10
    """).fetchdf()
    print(hashtag_analysis)

    return df

# Run the function
data = query_with_duckdb_and_iceberg()
Connecting to Iceberg catalog...
Tables in linkedin_data: posts
Available columns: post_id, content, hashtags, url, timestamp
Loaded 190 rows from posts
Most recent posts:
post_id content_preview \
.. ... ...
15 7325991787351658498 and were initially designed as convenient feat...
16 7323125315566714880 Stop by at 2025 Conference booth S-0948 to mee...
17 7323363303634710528 👏 👏 Applause to the incredible joint presentat...
18 7323366126279659520 announced a significant expansion of its AI-Na...
19 7323760583944679426 Live from RSA Conference 2025: swept the mobil...
timestamp
.. ...
15 2025-05-12 14:37:21.366134
16 2025-05-10 14:38:38.205988
17 2025-05-10 14:38:38.205710
18 2025-05-10 14:38:38.205322
19 2025-05-10 14:37:22.335793
[20 rows x 3 columns]
Time analysis of posts:
post_date post_count
0 2024-06-21 19
1 2024-07-21 11
2 2024-08-20 13
3 2024-09-19 8
4 2024-10-19 11
5 2024-11-18 5
6 2024-12-18 10
7 2025-01-17 16
8 2025-02-16 18
9 2025-03-18 17
Hashtag analysis:
hashtag frequency
0 MobileSecurity 56
1 AntiBot 55
2 FraudPrevention 53
3 SocialEngineering 52
4 AntiMalware 52
5 AntiCheat 50
6 GeoCompliance 50
7 CyberSecurity 49
8 ThreatResolution 48
9 DevOps 42Conclusion
The zero egress fees from R2 are particularly compelling for multi-cloud environments, and the use of open standards like Apache Iceberg ensures you’re not locked into a single vendor.
As the data landscape continues to evolve, this approach represents a return to simplicity - focusing on outcomes rather than infrastructure management. Sometimes, a poor man’s data lake is all you need to solve your actual business problems.
Next, I’m planning to play with serverless DuckDB. Ah, also need to write how to trigger by events updating catalog data after pipiline gets new data.